How Do Businesses Turn Marketing Data Into Better Decisions?
More marketing data does not produce better decisions on its own. How to connect the right sources, read the story behind the numbers, and end every report with an action.
Businesses have more marketing data than ever, but having more numbers does not automatically lead to better decisions. Teams still need to work out what changed, why it changed, and what they should do next.
That is where marketing analytics becomes valuable. The goal is not to collect every possible metric. It is to connect the right data sources, understand the story behind the numbers, and turn that understanding into a practical decision.
What does it mean to turn marketing data into decisions?
Turning marketing data into decisions means using performance information to choose a specific action, such as changing a budget, improving a landing page, revising a campaign, or investing more in a successful channel.
A report that says website traffic increased is informative. A report that explains which channel drove the increase, whether those visitors converted, and what the business should do next is useful for decision-making.
This distinction matters because marketing teams often confuse activity with progress. Impressions, clicks, sessions, followers, and traffic can all increase without improving revenue or qualified demand.
A decision-focused process asks four questions:
- What happened?
- Why did it happen?
- Does it matter to the business?
- What should we do next?
The answers do not always come from one platform. A change in paid search performance may affect website traffic, branded search, conversions, or the performance of other channels. Looking at only one source can hide that relationship.
Why do disconnected marketing channels make decisions harder?
Disconnected channels make it difficult to understand how different activities work together. Google Analytics may show what happened on the website, Google Ads may show campaign costs, and Search Console may show organic search visibility, but the data can be difficult to compare manually.
Marketing teams may also use Meta Ads, Instagram, Facebook, email platforms, CRM systems, ecommerce tools, or other specialist software. Each platform uses its own terminology, attribution model, date settings, and reporting interface.
That creates several common problems:
- Data has to be exported from multiple platforms.
- Metrics may use different definitions.
- Reports take longer to prepare.
- Small inconsistencies can undermine confidence.
- Analysts spend more time assembling numbers than interpreting them.
The result is often a collection of channel reports rather than a clear business view. Decision-makers then receive a large amount of information but little guidance.
This is why marketing data analytics should focus on comparison and context, not just collection. The important question is rarely "How many clicks did this channel receive?" It is more often "How did this channel contribute to the outcome, and what should we change?"
How can marketing data analytics reveal what is really working?
Marketing data analytics reveals what is working by combining channel performance with business outcomes. It helps teams compare traffic, spend, conversions, engagement, and visibility rather than reviewing each metric in isolation.
For example, a business might discover that:
- Paid traffic produces more visits but organic search produces more qualified leads.
- A campaign has a strong click-through rate but a weak conversion rate.
- A landing page attracts search traffic but does not move visitors towards an enquiry.
- A social post generates engagement but little measurable website activity.
- A drop in conversions happened at the same time as a change to a key page.
This type of analysis requires more than a single headline metric. It requires the ability to break results down by campaign, source, landing page, device, location, or time period.
Google's Analytics documentation and Search Console documentation both emphasise the importance of understanding reports in context. A metric is only meaningful when the business knows what it measures, how it was collected, and how it compares with a relevant period or objective.
What should teams compare before making a marketing decision?
Teams should compare the current result with a relevant previous period, campaign objective, or business target. Comparing unrelated numbers can make a report look precise while producing a misleading conclusion.
Useful comparisons include:
- Current period versus the previous period
- Current period versus the same period last year
- Paid versus organic performance
- Campaign cost versus conversions
- Landing-page traffic versus lead or sales activity
- Search visibility versus clicks
- Engagement versus downstream actions
The correct comparison depends on the question. A seasonal retailer may need a year-on-year comparison, while a campaign manager may need to compare performance before and after a launch.
How does marketing reporting support better decisions?
Marketing reporting supports better decisions when it explains performance clearly and ends with a recommended action. The best reports reduce complexity for the reader instead of passing the work of interpretation to them.
A strong report should include:
- A concise summary of what changed
- The most important supporting metrics
- A comparison with a relevant period
- The likely reasons for the change
- Any limitations in the data
- A short list of recommended actions
This structure works for internal management reports, client updates, campaign reviews, and board presentations.
Poor reporting often follows the opposite pattern. It includes too many charts, repeats platform terminology, and leaves the reader to work out what matters. A report can be accurate and still fail if the audience cannot connect it to a decision.
How can businesses make marketing reporting more useful?
Businesses can make reporting more useful by designing it around recurring decisions rather than around the structure of the platforms they use.
For example, a monthly report might be organised around questions such as:
- Are we attracting the right audience?
- Which channels are creating meaningful outcomes?
- Is our current budget being used efficiently?
- Which campaigns deserve more investment?
- What should we test next month?
This is more useful than creating separate sections for every platform and listing every available metric.
A tool such as Analyse8's AI marketing analytics platform is designed around this question-led approach. Users can ask questions about connected Google and Meta data in plain English, compare channels and periods, and follow up without rebuilding the analysis from scratch.
The value is not simply that the tool produces an answer. It is that the answer can become part of a report that other people can understand and act on.
What should a useful marketing dashboard show?
A useful marketing dashboard should show the metrics that help a specific audience make decisions. It should provide enough context to explain performance without overwhelming the reader with every available data point.
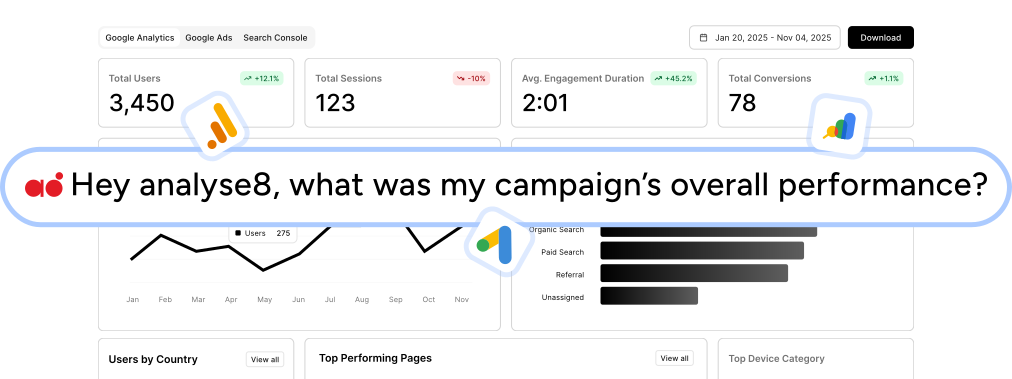
A practical dashboard usually includes:
- The main business outcome
- The channels contributing to it
- Relevant cost or efficiency measures
- Trends over time
- Important changes or anomalies
- A clear interpretation of the result
- Recommended next actions
The dashboard should also make it easy to identify what needs attention. If every metric has the same visual emphasis, important changes can disappear among less meaningful numbers.
Dashboards are particularly useful for monitoring performance between formal reports. They can help teams spot a sudden increase in cost, a decline in organic clicks, or a change in conversion volume before the next monthly review.
However, dashboards do not replace analysis. A dashboard can show that a metric moved. It may not explain why it moved or whether the change requires action. That is why dashboards and question-led analysis work best together.
How should businesses evaluate marketing reporting tools?
Businesses should evaluate marketing reporting tools based on how well they support the full path from data collection to decision-making. A tool that produces attractive charts but requires extensive manual work may not solve the underlying problem.
Important evaluation criteria include:
Can the tool connect the relevant data sources?
A business should be able to analyse the channels that influence its decisions. These may include Google Analytics 4, Google Ads, Google Search Console, Meta Ads, Instagram, and Facebook.
Can users ask questions without specialist skills?
Not every marketer knows SQL, data modelling, or dashboard configuration. Natural-language analysis can make data more accessible to founders, consultants, account managers, and other non-technical users.
Does the tool reconcile data?
Different platforms can report different totals because they use different definitions, attribution methods, and processing times. A useful tool should make those differences clear and avoid presenting mismatched figures as though they are directly comparable.
Can the output be shared easily?
The analysis is only useful if the intended audience can access it. Analyse8 lets users create white-labelled reports, export polished PDFs, share reports through public URLs, and use embeddable reports where a report needs to sit inside another digital experience.
The AI-powered client reporting feature is particularly relevant for agencies and consultants, but the same workflow can help in-house teams prepare recurring updates for managers and stakeholders.
Does it reduce recurring work?
A reporting process should become easier over time, not create a new manual task every month. Analyse8 supports report generation and, on relevant plans, scheduled reporting so teams can spend less time rebuilding routine updates.
How can SEO data improve marketing decisions?
SEO data can improve marketing decisions by connecting search demand with visibility, traffic, and wider marketing performance. It can help a business decide which content to create, which pages to improve, and which search opportunities deserve investment.
Useful SEO questions include:
- Which keywords are relevant to our products or services?
- Who currently ranks for an important search term?
- Which pages are close to ranking on the first page?
- Are competitors earning links that we do not have?
- Does a page have technical or on-page issues?
- Are rankings and organic clicks improving over time?
Analyse8's SEO Tools add-on includes keyword research, SERP analysis, backlink checks, and on-page analysis. These tools can be used alongside connected marketing data rather than in a completely separate workflow.
For example, a team might use keyword research to find a potential topic, SERP analysis to understand the current results, and on-page analysis to improve an existing page. Search Console and analytics data can then help evaluate whether the work generated more visibility, clicks, engagement, or conversions.
This creates a more complete decision loop:
- Identify an opportunity.
- Assess the competitive landscape.
- Improve or create the relevant asset.
- Measure the result.
- Decide whether to expand, adjust, or stop the activity.
The SEO add-on uses a credit-based model, so teams can use the research they need without managing a separate SEO platform for every project. It is designed for businesses, agencies, and consultants that want search research alongside their wider marketing workspace.
How does Analyse8 turn marketing questions into practical answers?
Analyse8 turns marketing questions into practical answers by combining connected data sources with conversational analysis and report generation. Instead of starting with a blank dashboard, users can ask a question in plain English and then investigate the answer through follow-up questions.
A typical workflow looks like this:
- Connect relevant marketing accounts.
- Ask a question about performance.
- Compare channels, periods, campaigns, or pages.
- Ask follow-up questions to understand the result.
- Turn the answer into a shareable report.
- Use the finding to choose the next action.
For example, a marketer could ask which channels generated the strongest results last month, then ask whether paid or organic activity contributed more to those results. The final answer could become a branded PDF, a public report URL, or an embeddable report for a client portal or internal workspace.
You can learn more about Analyse8 and how it brings marketing analytics, reporting, and SEO research into one workspace.
The important point is that the tool supports a decision process rather than simply displaying another set of numbers. The user starts with a business question, checks the evidence, and produces an output that can be shared with someone responsible for acting on it.
How can a business build a decision-focused marketing workflow?
A business can build a decision-focused marketing workflow by connecting reporting to a regular cycle of questions, analysis, action, and review.
A simple process is:
1. Start with a business question. Begin with a question that matters to the organisation, such as whether a campaign is producing enough qualified demand or whether a channel deserves more budget.
2. Choose the evidence. Select the data sources and metrics that can answer the question. Avoid including metrics simply because they are easy to access.
3. Compare and investigate. Look at relevant time periods, channels, campaigns, audiences, and landing pages. Investigate unusual changes before presenting a conclusion.
4. State the decision. Every report should make clear what the team should continue, change, test, or stop.
5. Review the outcome. After the decision has been implemented, measure what happened and update the next report with the result.
This process makes marketing analytics more practical. It also creates a record of why decisions were made, which helps teams learn from both successful and unsuccessful campaigns.
Frequently asked questions
What is the difference between marketing data and marketing insights?
Marketing data is the raw information collected from platforms such as analytics, advertising, search, and social tools. Marketing insight is the explanation of what that data means, why it matters, and what action the business should take.
How does marketing analytics improve decision-making?
Marketing analytics improves decision-making by helping teams compare performance, identify meaningful changes, and understand the factors behind those changes. It turns disconnected metrics into evidence that can support decisions about budgets, campaigns, content, and customer acquisition.
What should a marketing dashboard include?
A marketing dashboard should include the business outcomes being monitored, the channels contributing to them, relevant trends, efficiency measures, and important changes that need attention. It should also provide enough context for the reader to understand what action may be appropriate.
Why is marketing reporting important for growing businesses?
Marketing reporting is important because growth creates more channels, campaigns, and data to manage. A consistent reporting process helps businesses understand what is working, communicate results clearly, and avoid making decisions based only on isolated platform metrics.
How do marketing reporting tools save time?
Marketing reporting tools save time by connecting data sources, automating calculations, presenting recurring metrics, and reducing manual exports and formatting. The greatest benefit comes when the tool also helps interpret the data and produce a report that is ready to share.
Can small businesses use marketing analytics without a data team?
Yes. Small businesses can use marketing analytics without a dedicated data team when the tools are accessible and the reporting process focuses on clear business questions. Natural-language analysis and automated reports can reduce the technical work required to understand performance.


